Standpoint Research is in effect a one-man operation run by Ronnie Moas. Although Ronnie does have a few assistants — all with MBA/CFA designation — he has made (and is responsible for) every one of the more than 1000 stock recommendations issued via Standpoint Research since 2004. Ronnie is also the only person who has ever had access to the 155-variable model he developed (1998-2003). That model generates ideas — recommendations are made only after the computer model generated ideas pass heavy fundamental and subjective overlays.
Ronnie also covers cryptocurrency and his name has become synonymous with Bitcoin. In July 2017, when Bitcoin was trading below $2,500, Ronnie set a $50,000 target price for 2027 that made headlines worldwide — December 2017 Bitcoin was already above $16,000. Click Here for more on Bitcoin and Crypto
In the screenshots below you will see Ronnie receiving an award from the Investorside Research Association for his four-year track record through December 31, 2008. Below there, you will find screenshots showing Ronnie and his top ranking for performance since 2009 and through 2017. Since 2008, all of the more than 700 recommendations Ronnie issued were time-stamped by Yahoo! Finance, Dow Jones and Bloomberg newswires.

Ronnie receiving award from Investorside Research Association for 2004-2008 performance.
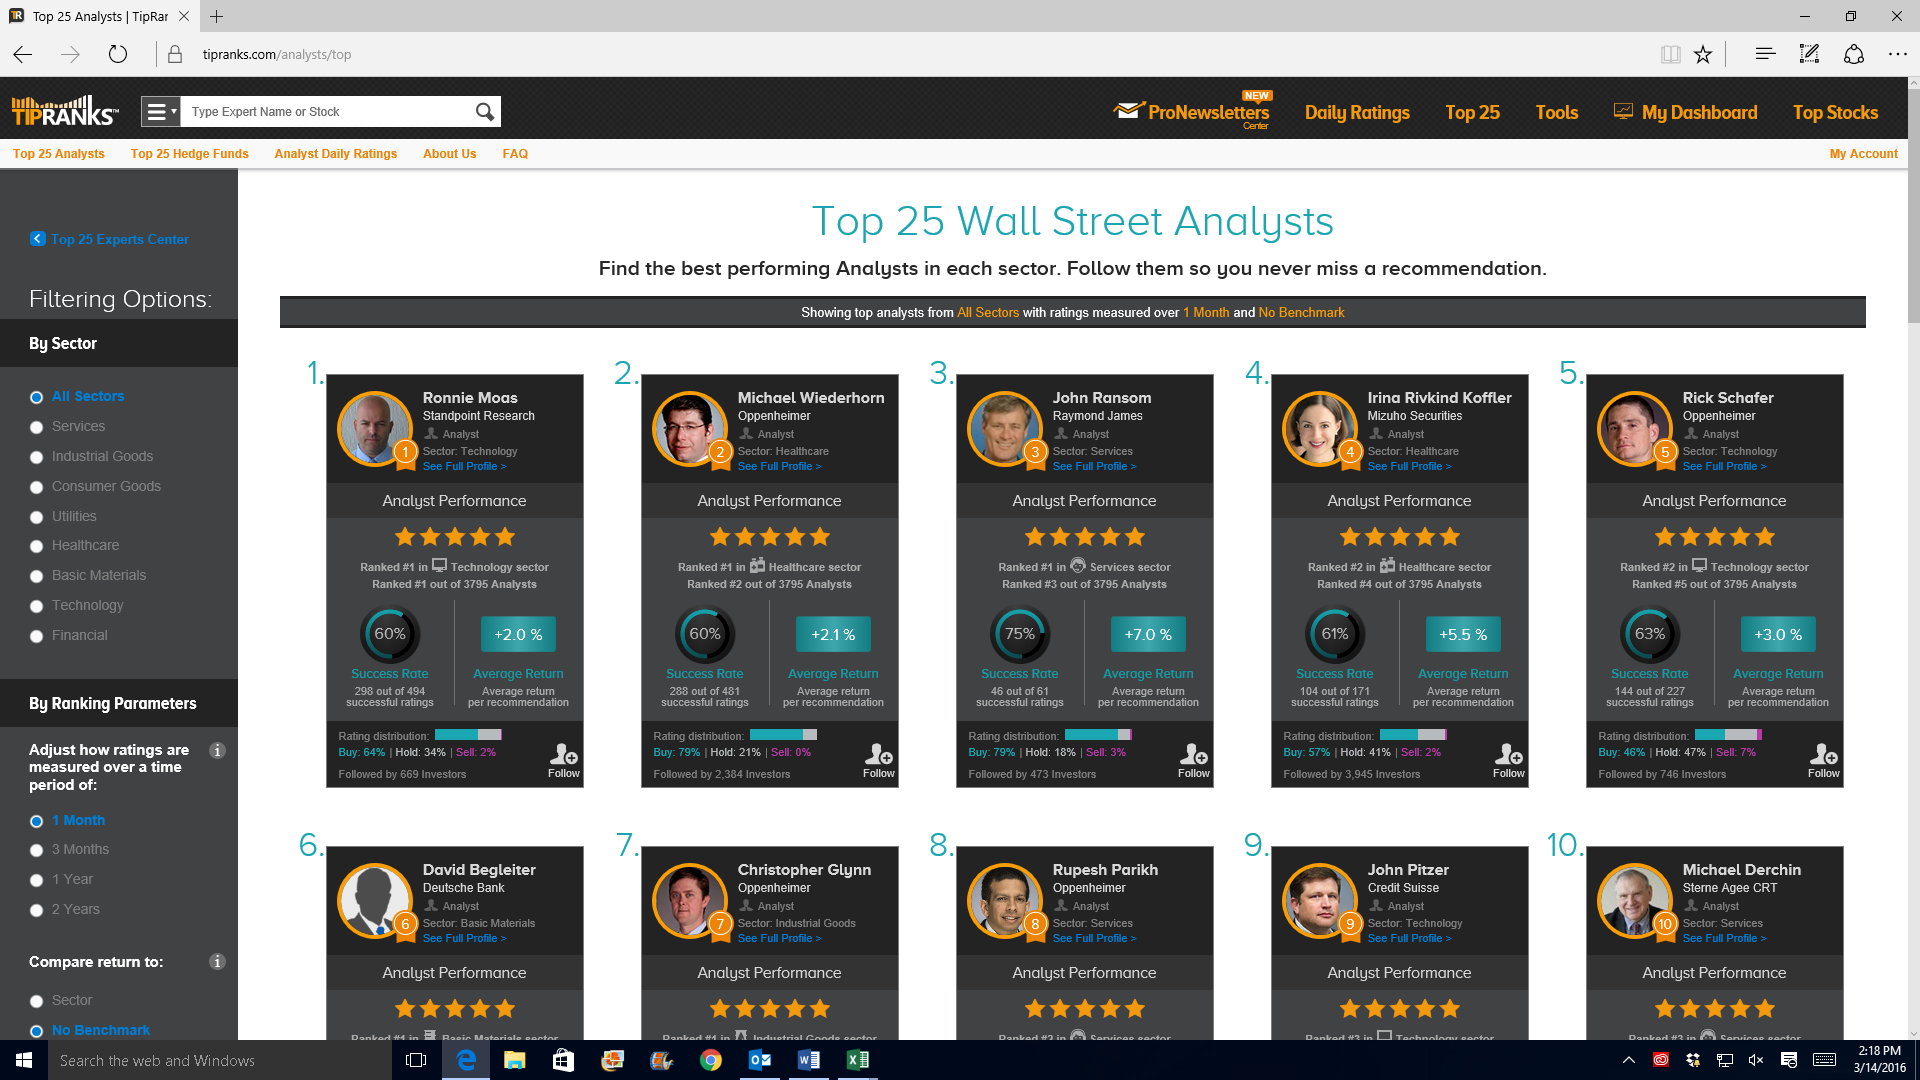
# 1 ranking versus 3,795 analysts for 2009-2017 performance covering 494 recommendations.
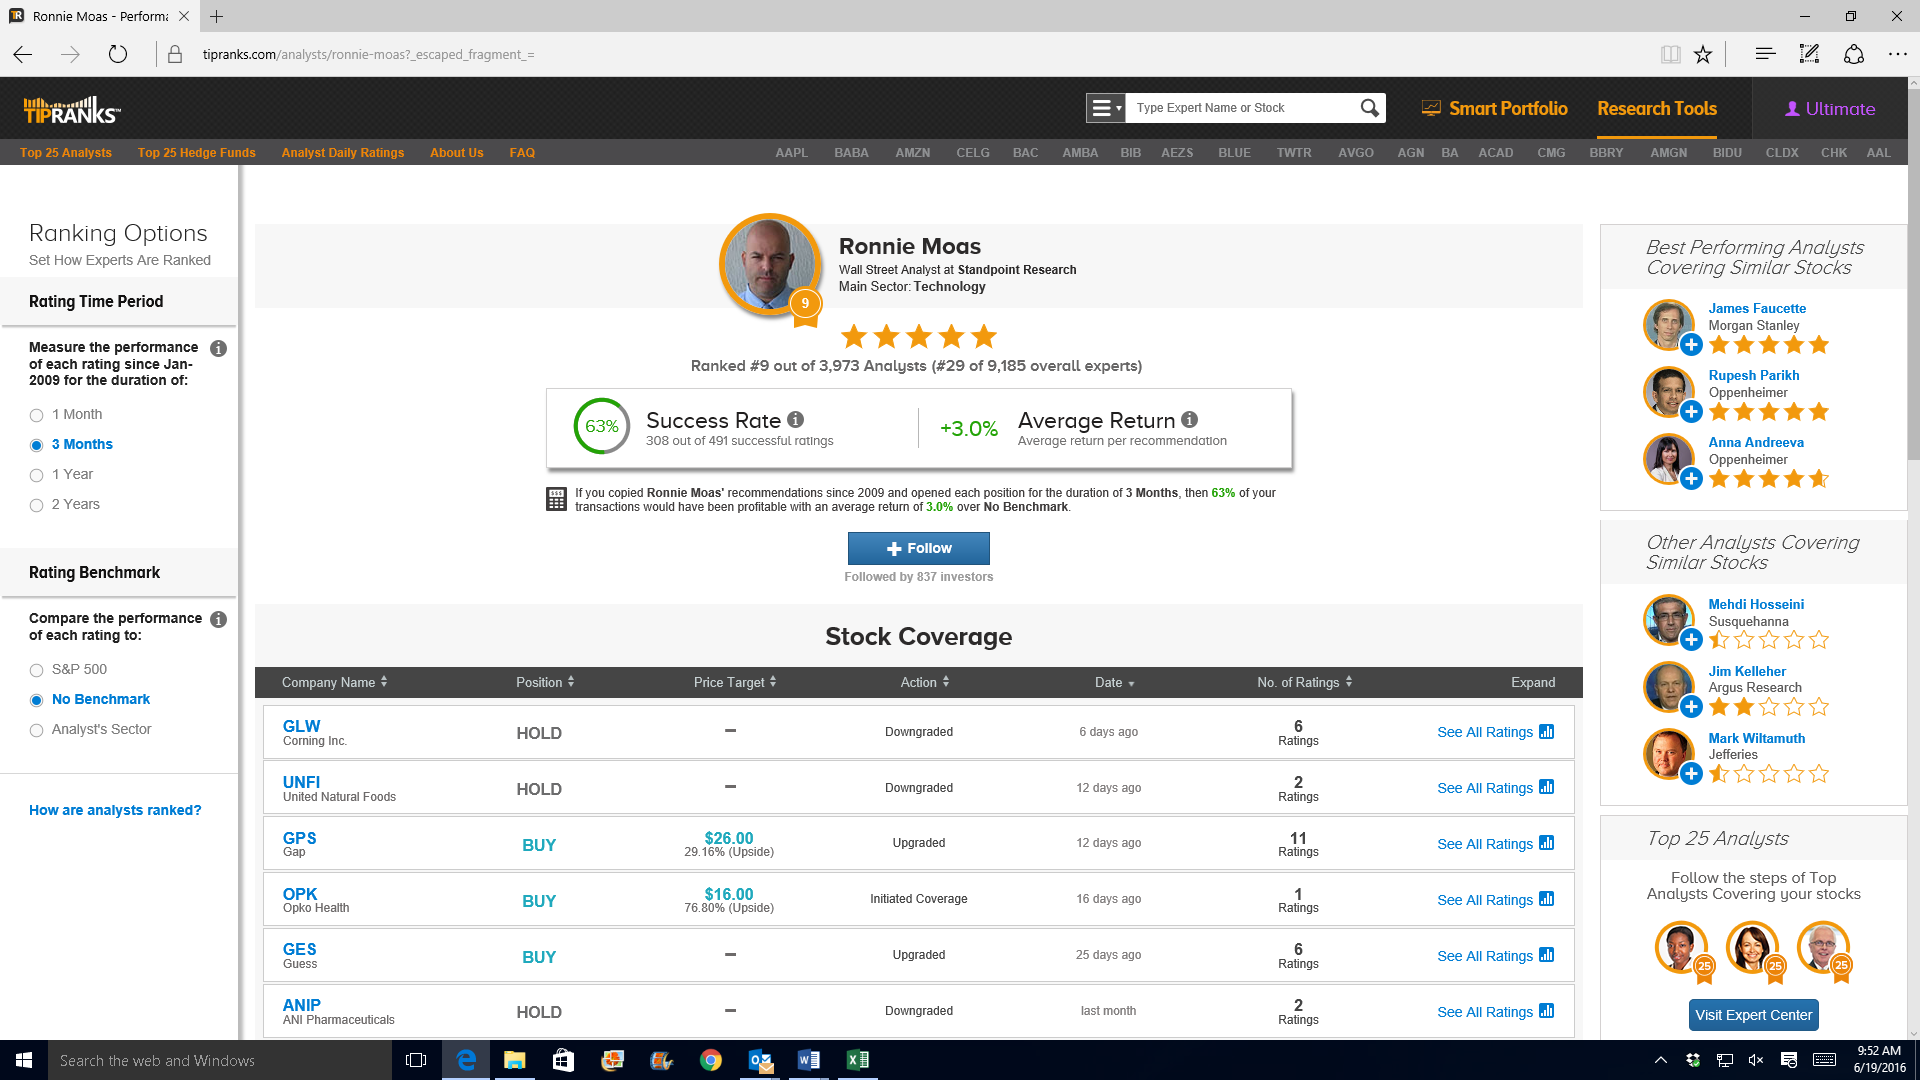
# 29 ranking versus 9,185 experts for 2009-2017 performance covering 491 recommendations.
Since 2004, Ronnie beat the S&P-500 by at least 500 bps with 66% of his recommendations – no firm has been able to match that accuracy. Also impressive is the fact he reached this mark without taking many sector, market capitalization or directional bets. There are some analysts and professionals in the industry with a higher accuracy but that is because most (or all) of their recommendations came from the same (outperforming) sector and/or they had a statistically insignificant sample size of data from which to draw a fair conclusion.
Historically, Standpoint Research has been with 55-70 open recommendations during over-bought market conditions and 80-95 open recommendations during over-sold conditions. In recent years, approximately 20% of our recommendations were with ADR status – International names (from Russia, Colombia, India, Canada, Israel, Germany, South Korea, China and Brazil) that trade on the NASDAQ and NYSE.
Ronnie has an excellent reputation and track record with no conflicts of interest and has given more than 100 television, newspaper, magazine and radio interviews in recent years.
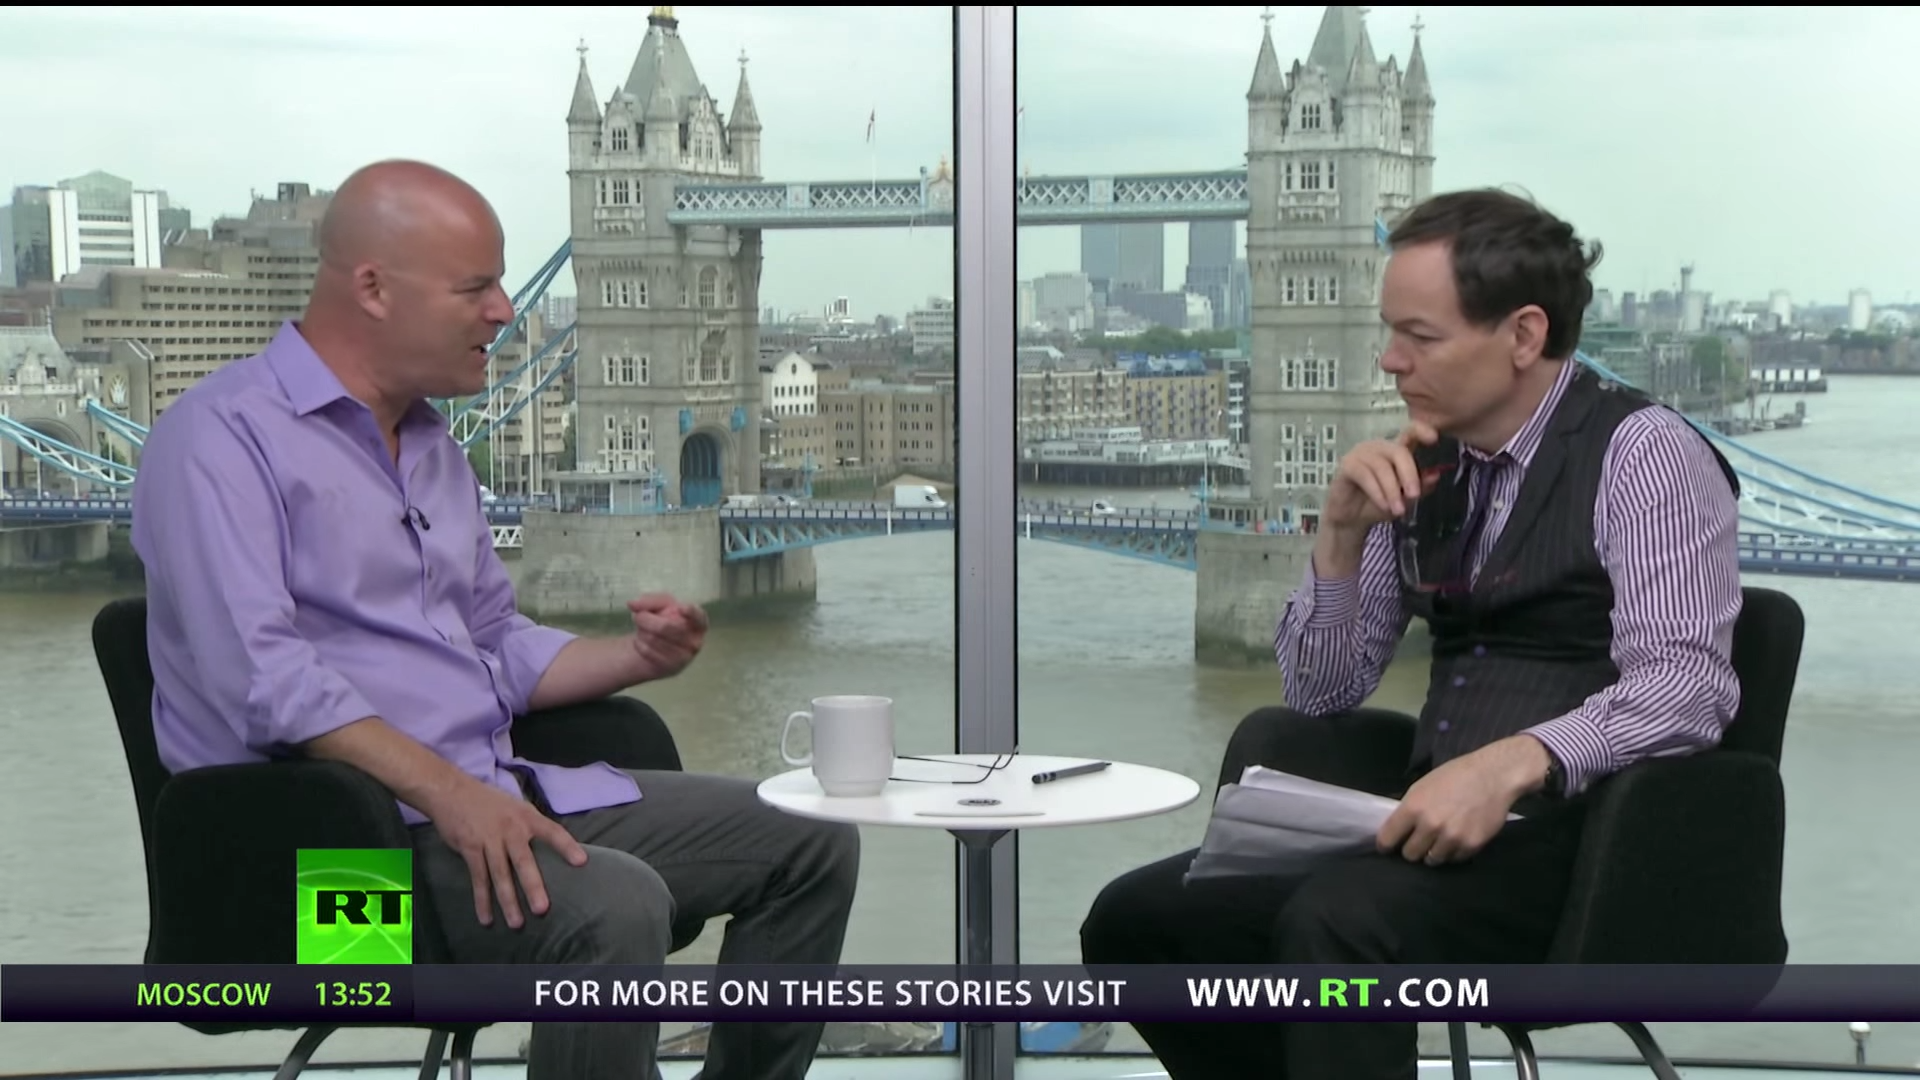
Ronnie on The Keiser Report

Ronnie on CNBC
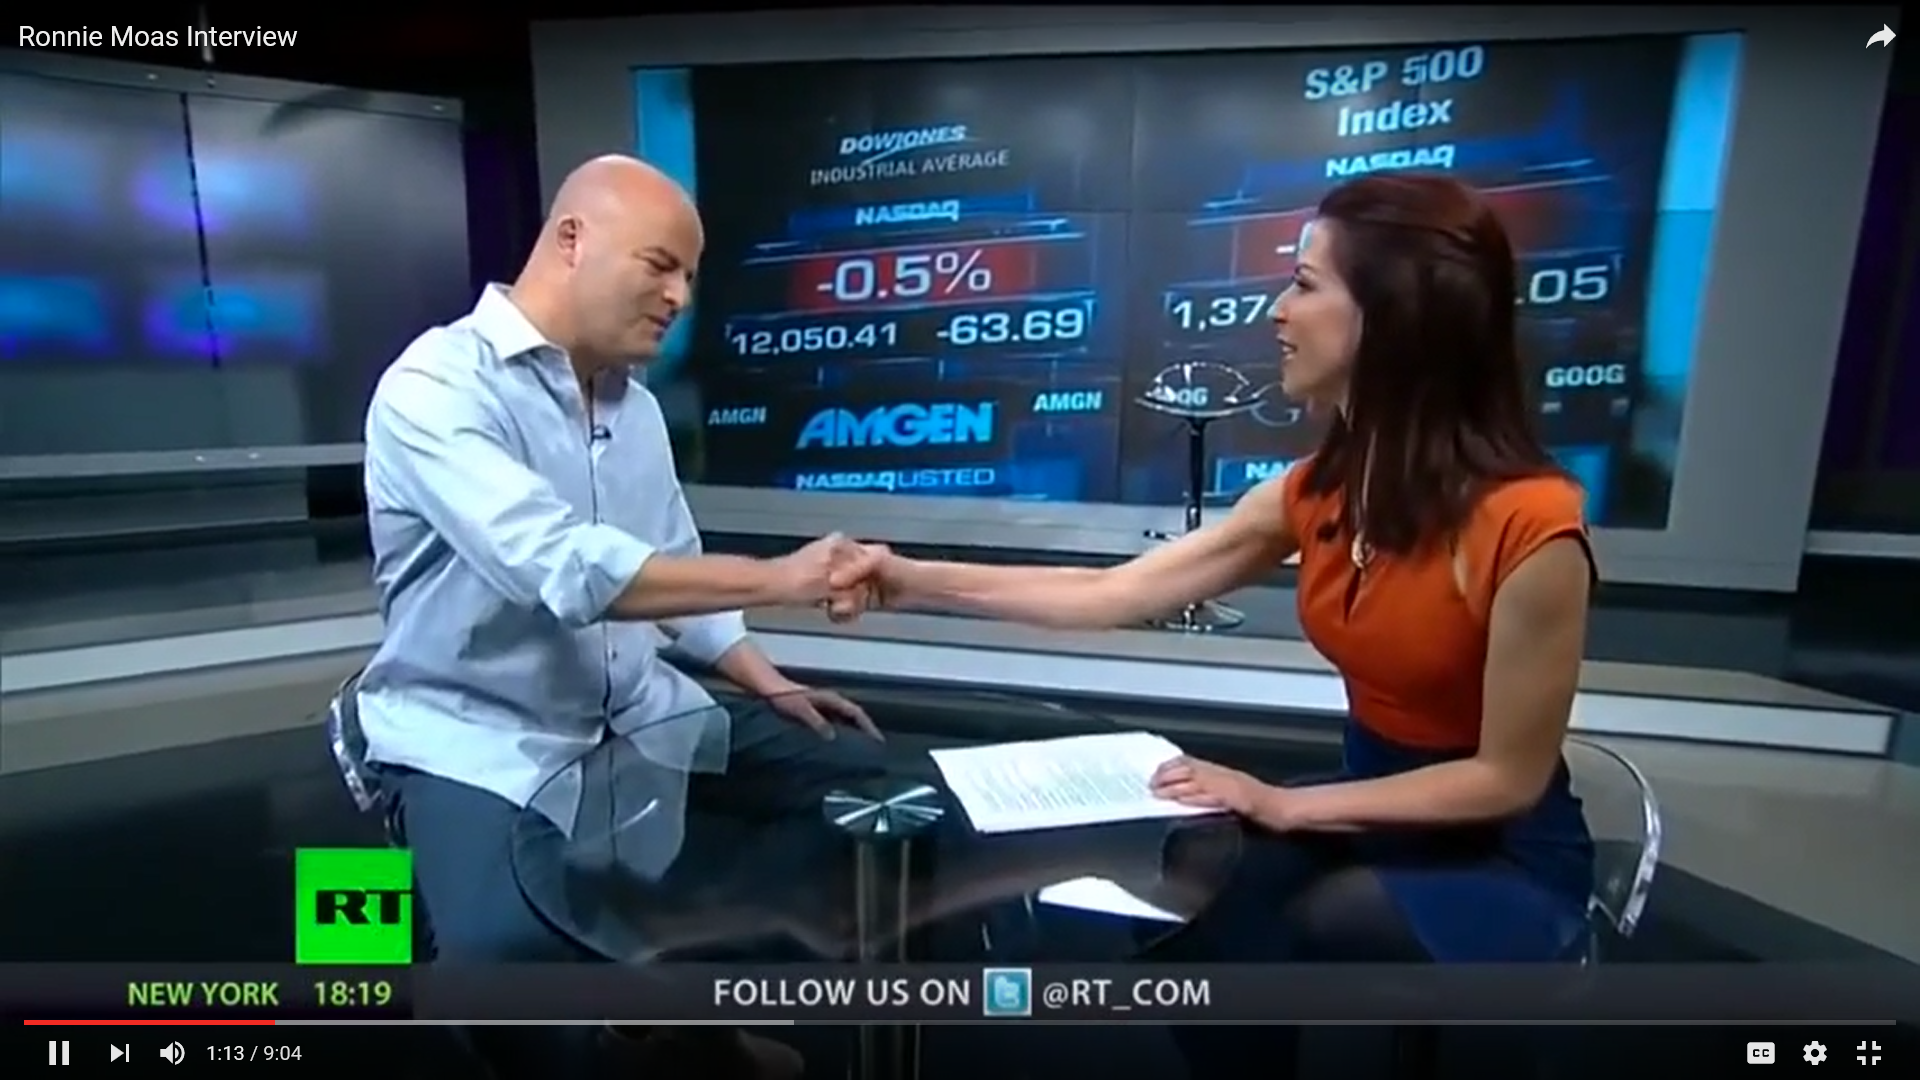
Ronnie on Breaking the Set

August 1, 2017 / cointelegraph.com